A home solar array can look perfectly healthy while quietly losing output. Dust, shade, inverter faults, and weak connections may appear only as small changes on an app. That is why learning how to monitor home solar energy production remotely matters. It turns a rooftop system into a measurable energy asset, not a set-and-forget purchase.
The International Energy Agency’s Renewables 2024 report estimates that global renewable capacity additions reached almost 510 gigawatts in 2023. Solar photovoltaics represented about three-quarters of that growth. More panels mean more household data, and more opportunities to detect underperformance early. The U.S. Department of Energy also recommends tracking production, consumption, system alerts, and historical trends through reliable monitoring platforms. NREL’s photovoltaic operations guidance emphasizes a simple goal: maintain expected production and identify problems before they become expensive.
As NREL photovoltaic researcher Andy Walker puts it, “The purpose of operations and maintenance is to keep the system producing energy.” That principle sounds obvious. It is often missed.
These seven tips focus on practical remote checks. You will see how to compare daily output with weather conditions, verify inverter communication, review battery behavior, and investigate sudden drops. Use the same time window each day. Save screenshots when readings look unusual. A cloudy afternoon can mislead you. So can a faulty meter.
Remote monitoring is powerful, but it is not perfect. Internet outages can hide real problems, while software estimates may differ from utility bills. Treat the dashboard as evidence, not absolute truth. When data conflicts, contact a qualified solar professional and compare multiple sources.
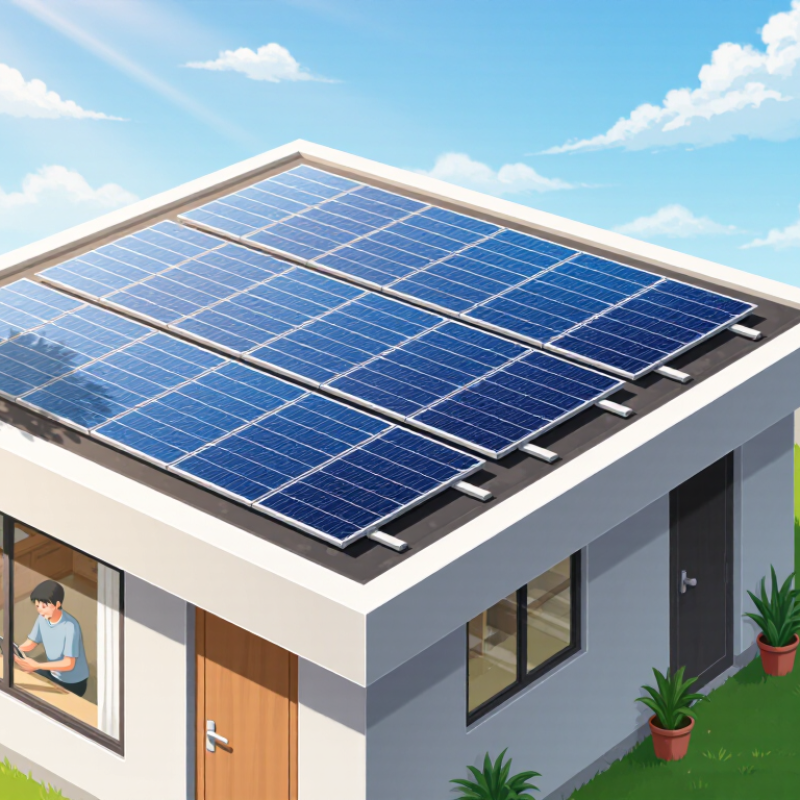
Choosing a solar monitoring system with remote access can make daily energy management far easier. A clear phone dashboard should show current output, battery charge, household use, and grid exchange. Avoid systems that display only monthly totals. They hide useful clues.
Check whether the system sends alerts for low production, communication failures, and unusual nighttime consumption. Alerts should arrive by email or app notification. Remote access also needs strong account security, including two-factor authentication and separate user permissions. An installer may need technical access, but that access should not remain permanent.
Look for data that updates every few minutes, not once each day. This helps you compare a cloudy morning with a clear afternoon. The system should also retain historical records that can be downloaded for maintenance reviews. Confirm that it works when you are away from home. A dashboard that fails on mobile data is not truly remote.
Compatibility matters too. Ask whether the monitor supports your inverter, batteries, meter, and future equipment. Independent readings can expose errors, but no platform is perfect. I would compare dashboard figures with the utility meter during the first few weeks. Small differences may be normal, while large gaps deserve investigation. Keep screenshots of unusual events. They give technicians clearer evidence than memory alone.
Connecting an inverter or energy meter to the internet makes solar production visible beyond the home. A wired connection is often more stable than wireless service, especially near thick walls or electrical equipment. Check the device manual before changing network settings. Incorrect configuration can interrupt data reporting.
My first setup was not perfect. The signal dropped whenever the router restarted, so the monitoring app showed missing afternoon data. I later enabled automatic reconnection and placed the network device closer to the inverter. Small changes helped. Keep login details private, use a strong password, and install firmware updates from the manufacturer’s official support channel. Never expose the device directly to the public internet without proper protection.
Remote dashboards can display power output, daily yield, voltage, and error codes. Compare these readings with your electricity meter during clear weather. Large differences may indicate a data delay, shading, wiring trouble, or a sensor that needs checking. Set alerts for unusual shutdowns, repeated fault codes, or sudden production drops. Alerts are useful, but they are not proof of a fault. Cloud platforms can also experience outages, so export readings periodically for your own records. Have a qualified technician inspect electrical problems rather than opening energized equipment yourself.
7 Tips for Monitoring Home Solar Energy Production Remotely
Set Up a Reliable Mobile or Web Monitoring Account
A dependable monitoring account begins with accurate system details. Enter the array size, roof orientation, inverter capacity, and installation date carefully. I once entered the wrong system size, making normal production look disappointing. Small errors can distort every later decision.
Use a unique password, multi-factor authentication, and a recovery email you check regularly. Give household members separate access when possible. Set alerts for offline equipment, sudden output drops, and unusual overnight consumption. Keep notifications practical. Too many alerts become background noise. The International Energy Agency’s Photovoltaic Power Systems Programme reported global solar capacity above 1.4 terawatts in 2023. That scale makes dependable digital oversight increasingly important for ordinary homeowners.
Review the account from both a phone and a web browser. Confirm that daily, monthly, and lifetime graphs show matching figures. Check the time zone, electricity rate, and battery settings. Export one month of data and store it with your utility bills. The U.S. Department of Energy recommends comparing system performance with expected solar resource and site conditions. Weather still matters. A cloudy week is not automatically a fault, while a clear week with sharply reduced output deserves investigation. I would also test every alert manually, although many users skip this step and regret it later.
Practical monitoring guidance for a typical residential photovoltaic system. Example values are representative of a 5 kW rooftop system and should be adjusted for local weather, system size, shading, and seasonal conditions.
| Tip | Remote Monitoring Setup | Key Data to Track | Typical Reference or Alert Point | Recommended Frequency | Action to Take |
|---|---|---|---|---|---|
| 1 | Create a secure mobile or web monitoring account using a unique password and two-factor authentication when available. | Account status, system connection, last data update, and user access permissions. | The dashboard should show a recent update, normally within the last 5–15 minutes when the system is operating and connected. | Check during initial setup and whenever access or connectivity changes. | Confirm the correct system, time zone, location, and authorized users are linked to the account. |
| 2 | Turn on push, email, or text notifications for communication failures and equipment alarms. | Inverter status, alarm code, grid connection, communication status, and alarm duration. | Investigate a communication outage lasting more than 30–60 minutes, especially during daylight hours. | Enable alerts continuously; review notifications as they arrive. | Check the internet connection, gateway, circuit breaker, and inverter display before contacting a qualified technician. |
| 3 | Use daily and monthly production views instead of relying only on the current power reading. | Daily energy yield in kWh, monthly energy yield, peak power in kW, and production history. | A clear day may produce roughly 15–30 kWh from a 5 kW system, depending on season, location, orientation, and shading. | Review daily; compare monthly totals with previous months and the same season in prior years. | Look for persistent declines rather than reacting to a single cloudy or rainy day. |
| 4 | Compare solar production with household consumption through the same monitoring portal or an approved energy meter. | Solar generation, home consumption, grid imports, grid exports, and self-consumption rate. | Self-consumption equals on-site solar used divided by total solar production; the value varies widely with household habits and battery use. | Review weekly and after major changes in occupancy or appliance use. | Shift flexible loads such as water heating, laundry, or vehicle charging toward sunny hours when practical. |
| 5 | Use weather and irradiance information to interpret short-term changes in production. | Cloud cover, rainfall, temperature, shading events, and production per installed kW. | Output normally falls during heavy cloud, rain, snow, or temporary shading; compare with nearby clear intervals before assuming a fault. | Review when production changes unexpectedly or weather conditions vary sharply. | Record weather-related explanations in monthly notes so seasonal performance trends remain meaningful. |
| 6 | If a battery is installed, enable battery status and reserve-level notifications. | State of charge, charge and discharge power, backup reserve, operating mode, and temperature warnings. | Many systems allow a configurable backup reserve; a common example is 20–30%, but the correct setting depends on household needs and system design. | Check during severe-weather periods and review weekly during normal operation. | Verify the operating mode and reserve setting before a forecast outage; do not bypass safety warnings. |
| 7 | Keep a simple monthly record and export data regularly for long-term comparison. | Monthly kWh, peak kW, downtime, alarms, estimated emissions avoided, and utility meter readings. | A repeated month-over-month decline after accounting for weather, shading, and seasonality deserves investigation. | Export or save data monthly; perform a deeper review every 6–12 months. | Use the record to support maintenance, warranty, energy-bill checks, and discussions with a qualified solar professional. |
7 Tips for Monitoring Home Solar Energy Production Remotely
Track Daily Solar Output and Household Energy Use
Remote monitoring makes solar performance easier to understand from the kitchen table. Check the system at the same time each day. A morning reading and an evening reading reveal different patterns. Record solar production, household consumption, and energy sent to the grid.
Begin with a normal baseline during clear weather. Then compare cloudy, rainy, and unusually hot days. Weather changes matter, but sudden drops need attention. A clean panel may still produce less when shadows reach it. Watch the hourly graph for flat sections or sharp interruptions. Those details can reveal faults earlier than a monthly bill.
Use consumption data beside production data. A washing machine running at noon may use fresh solar power directly. Evening heating, cooking, and charging can increase grid use. Set alerts for unexpected production losses, but avoid treating every warning as an emergency. I once misread a short dip caused by tree shade. That mistake showed me the value of checking local weather and physical conditions first.
Compare remote readings with the household meter each week. Small differences are normal because systems measure energy at different points. Large, repeated gaps deserve a qualified technician’s review. Keep screenshots and notes with dates, weather, and unusual appliance use. Clear records make professional troubleshooting faster and more reliable.
Remote monitoring becomes valuable when alerts explain changes, not merely announce them. Set a daily production alert below your system’s normal range. Use a rolling baseline from clear days, rather than one fixed number. A cloudy afternoon should not trigger panic. I once treated a low reading as a fault, but heavy rain had reduced sunlight for hours. That mistake showed why weather context matters. Set alerts for sudden drops, prolonged zero output, and unusual overnight consumption. Keep thresholds specific.
Reports provide evidence that alerts often lack. Review daily and weekly charts for energy produced, household use, and exported power. Compare similar dates, not only yesterday. Seasonal daylight changes can resemble equipment decline. Note shading from new construction, leaves, or a dirty panel. A small notebook beside the monitoring device can help. Record weather, maintenance, and unusual loads, such as an electric heater. Experienced technicians often check these details before recommending service. This prevents unnecessary visits, although remote data cannot confirm every physical problem.
Use email or phone notifications, but avoid sending every minor fluctuation. Too many alerts become background noise. Create a critical alert for no production during sunny daylight hours. Create a warning for a steady decline across several days. Check the timestamp and data connection before acting. A delayed upload can imitate sudden failure. Review monthly reports with a qualified solar professional when results remain unusual. Share graphs and weather notes. Remote data is powerful, but it is not perfect.
Use alerts and reports to identify performance changes before they become costly problems.
This example shows daily solar production from a typical residential photovoltaic system over two weeks. A noticeable drop below the expected range may indicate cloud cover, shading, inverter issues, or panel soiling. Remote alerts and weekly reports can help homeowners investigate changes quickly.
It should show current production, battery charge, household use, and grid exchange. Monthly totals alone hide useful clues. A clear hourly graph is better.
Data should refresh every few minutes, not only once daily. This helps compare a cloudy morning with a clear afternoon. Delayed data weakens troubleshooting.
Choose alerts for low production, offline equipment, communication failures, and unusual nighttime use. Email or app notifications are practical. Too many alerts become noise.
Use a unique password, multi-factor authentication, and a regularly checked recovery email. Give household members separate permissions. Technical access should end after service.
Check the array size, roof direction, inverter capacity, and installation date. Incorrect details can make normal output look poor. I once entered the wrong system size.
Compare clear, cloudy, rainy, and very hot days. Clouds and shadows can reduce output without indicating equipment failure. A clear day with sharply reduced production deserves attention.
Review production, consumption, and grid exchange together. A washing machine at noon may use fresh solar energy directly. Evening cooking and heating can increase grid use.
Compare readings weekly and check where each system measures energy. Small differences may be normal. Repeated large gaps need qualified technical review, not guesswork.
Export monthly data and save it with utility bills. Keep screenshots showing dates, weather, and unusual appliance use. Memory is imperfect, unfortunately.
Learning how to monitor home solar energy production remotely starts with choosing a monitoring system that supports secure access through a phone or web browser. Connect the inverter or energy meter to a stable internet connection, then create and configure a reliable monitoring account. Make sure the system is recording both solar generation and household electricity use so you can compare production with consumption over time.
Review daily and weekly data to understand output patterns, detect unusually low performance, and identify changes caused by weather, shading, or equipment issues. Set up alerts for communication failures, sudden production drops, or unusual energy use, and use regular reports to evaluate long-term results. By checking the system consistently and responding to notifications promptly, homeowners can maintain better visibility into their solar investment, improve energy habits, and recognize potential maintenance needs before they become more serious.

Vires Energy