Why is my solar battery not holding charge? This question often appears after a sunny day ends with a nearly empty battery. The problem may involve aging cells, incorrect settings, poor connections, shading, or unusually high household demand. A battery can look healthy while losing usable capacity internally.
Dr. Imre Gyuk, a recognized energy-storage expert and former U.S. Department of Energy program manager, has said, “Energy storage is the key to unlocking the full potential of renewable energy.” That principle matters here. Solar generation alone does not guarantee reliable storage. The battery, inverter, charge controller, wiring, and monitoring software must work together. Even a small voltage drop at a loose terminal can change the diagnosis.
Real troubleshooting starts with evidence. Check the battery’s state-of-charge reading against the inverter display. Review overnight loads, charging temperatures, error codes, and recent weather. A 10-year-old lithium battery deserves different expectations from a new unit. Lead-acid batteries require even closer attention to depth of discharge and maintenance.
Some explanations remain uncertain at first. A cloudy week can imitate battery failure. So can a refrigerator cycling overnight. Do not guess too quickly. Repeated deep discharges may permanently reduce capacity, but one poor night proves very little. This guide examines the most likely causes, practical checks, warning signs, and situations requiring a qualified solar technician. Never open a sealed battery or bypass protection controls. Safety comes before curiosity.
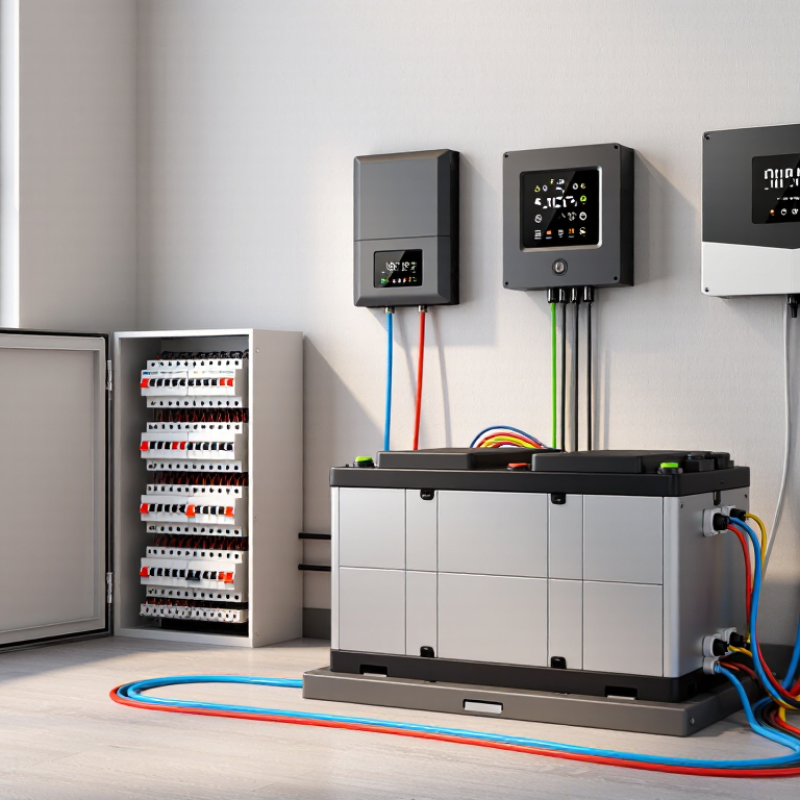
A solar battery that stops holding charge may not be defective. The chemistry needs checking first. LiFePO₄ batteries commonly deliver 3,000–6,000 cycles under controlled conditions. One cycle usually means using the battery’s full rated capacity, not one sunny day.
That figure is not a promise. High temperatures, deep discharges, and incorrect charging can shorten service life. In a field check, measure voltage after charging, then again after several hours without loads. A sharp drop may indicate a weak cell, an inaccurate battery monitor, or hidden consumption from an inverter. Check the charge settings too. LiFePO₄ batteries need a compatible charging profile, while ordinary lead-acid settings may cause poor performance.
Temperature matters. A battery stored in a hot enclosure can age faster, especially during daily cycling. Inspect cable lugs for looseness, corrosion, or warmth under load. Small resistance losses can look like lost capacity. Also test the battery at a known load, such as a heater with a measured wattage, rather than trusting the display alone.
I have seen diagnosis go wrong when technicians blamed the battery too quickly. The solar controller, wiring, and battery-management system can each create similar symptoms. A capacity test is more reliable than a single voltage reading. Record charging voltage, discharge time, temperature, and load size. The results may reveal a setup problem, not an exhausted battery.
China Top 10: Why Is My Solar Battery Not Holding Charge?
Step 1—Test State of Charge Using Battery Voltage, Current, and BMS Data
A reliable state-of-charge test starts with a fully rested battery. Disconnect charging and loads, then wait at least 30 minutes. Measure voltage directly at the battery terminals with a calibrated multimeter. Record temperature too. A reading of 52.1 volts on a 48-volt lithium battery may look healthy, but surface charge can mislead the diagnosis.
Voltage alone is not enough. Use a DC clamp meter to check charging and discharge current. Near zero current after rest gives a cleaner voltage estimate. Then open the battery management system data. Compare reported SOC, pack voltage, individual cell voltages, temperature, and protection status. A cell spread above roughly 50–100 millivolts deserves attention, especially under load. This is field experience, not a universal failure limit.
Small details matter. A loose terminal can imitate battery loss. So can a cold morning. The International Energy Agency reported 42 GW of global battery storage additions in 2023, showing how quickly these systems are expanding. More installations also mean more diagnostic mistakes. The U.S. Department of Energy notes that battery performance depends on temperature, operating conditions, and aging. I once trusted the BMS percentage too quickly. That was careless. Cross-check voltage, current, and cell data before replacing a battery. Use insulated test equipment and qualified service support for high-energy systems.
| No. | Battery System | Resting Voltage | Measured Current | BMS State of Charge | Battery Temperature | Voltage Interpretation | Initial Diagnostic Result |
|---|---|---|---|---|---|---|---|
| 1 | 12 V LiFePO4, 100 Ah | 13.35 V | 0.0 A | 52% | 24°C | Typical mid-range resting voltage for lithium iron phosphate. | Voltage and BMS broadly agree |
| 2 | 12 V LiFePO4, 100 Ah | 13.28 V | −18.6 A | 9% | 23°C | Load is active; voltage may temporarily sag under discharge. | Recharge and retest after rest |
| 3 | 12 V LiFePO4, 200 Ah | 13.46 V | +24.1 A | 96% | 26°C | Charging voltage is elevated because current is flowing into the battery. | Charging value appears normal |
| 4 | 24 V LiFePO4, 100 Ah | 26.71 V | 0.2 A | 48% | 22°C | Approximate resting voltage is consistent with a partially charged pack. | No immediate voltage anomaly |
| 5 | 24 V LiFePO4, 100 Ah | 25.86 V | −31.4 A | 7% | 25°C | Low voltage combined with a high discharge current indicates a nearly depleted pack. | Stop nonessential loads |
| 6 | 48 V LiFePO4, 100 Ah | 53.82 V | 0.0 A | 54% | 21°C | Resting voltage is plausible for a mid-state-of-charge 16-series battery. | Voltage reading is reasonable |
| 7 | 48 V LiFePO4, 100 Ah | 54.18 V | 0.0 A | 18% | 27°C | A large voltage-to-BMS mismatch can indicate inaccurate SOC calibration or recent charging. | Check SOC calibration history |
| 8 | 12 V lead-acid AGM, 100 Ah | 12.18 V | 0.0 A | 55% | 20°C | Resting voltage is consistent with a partially discharged AGM battery. | Confirm full-charge absorption time |
| 9 | 12 V lead-acid AGM, 100 Ah | 11.94 V | −42.0 A | 22% | 31°C | Heavy discharge and low terminal voltage can cause temporary voltage depression. | Retest after removing the load |
| 10 | 48 V LiFePO4, 100 Ah | 49.62 V | 0.0 A | 3% | 19°C | Very low resting voltage suggests deep discharge or a BMS low-voltage cutoff event. | Inspect BMS protection and charger |
| Testing note: Disconnect charging and loads before measuring resting voltage, then allow the battery to rest for approximately 30 minutes when practical. Record the meter voltage, charge or discharge current, BMS-reported SOC, temperature, and any protection status. Voltage alone is not a precise SOC gauge, especially for LiFePO4 batteries, because the voltage curve remains relatively flat through much of the usable capacity. | |||||||
When a solar battery stops holding charge, check its depth of discharge before replacing it. Lead-acid batteries commonly use a 50% DoD limit. A 12-volt, 200Ah battery should normally provide about 100Ah before recharging. Repeatedly using more can shorten its service life and reduce usable capacity.
Track the battery overnight with a shunt meter, not only the solar controller display. A heavy load can make the voltage appear dangerously low. Let the battery rest for several hours, then measure it with a calibrated multimeter. Around 12.2 volts often suggests approximately 50% charge, but temperature, battery age, and wiring can change this reading. Voltage is only a clue.
Look for practical signs. A small refrigerator may run normally at sunset, yet the battery may reach its cutoff before dawn. That pattern can indicate excessive DoD, weak capacity, or poor charging. Check electrolyte levels on serviceable flooded batteries, inspect terminals for corrosion, and confirm that the charger reaches the correct absorption stage. Do not add water to sealed batteries.
I have seen owners blame cloudy weather when daily loads quietly exceeded the battery’s safe capacity. That mistake is understandable. It is also expensive. Keep a simple log of morning voltage, estimated load, temperature, and charging time. If capacity remains low after careful charging, arrange testing by a qualified technician. The 50% rule is useful, but it is not a perfect diagnosis.
A solar battery may stop charging when its controller uses the wrong voltage profile. Check the battery manual before changing any setting. Record the recommended bulk, absorption, float, and low-voltage values. Then compare them with the controller display. Small errors matter. A 12-volt lithium battery, for example, may need settings that differ greatly from a lead-acid battery.
Use a reliable multimeter to measure voltage at the battery terminals during charging. The controller screen can show a different reading because of cable resistance. Also check the maximum charging current. An oversized solar array may push excessive current, causing the battery management system to disconnect suddenly. That interruption can look like a battery fault. Inspect loose terminals and warm cables carefully.
Temperature compensation needs special attention. It may be suitable for some battery types but harmful for others. Disable or adjust it only when the manufacturer permits this change. I once trusted factory defaults too quickly, and the battery repeatedly reached protection mode near midday. The settings looked reasonable, but the current limit was too high. Do not guess. Change one value at a time, wait through a complete charging cycle, and write down the result. Some readings remain confusing. That is normal.
Temperature protection can stop charging even when the battery appears healthy. Lithium batteries may suffer lithium plating when charged near or below 0°C. High temperatures can also accelerate capacity loss. The 45°C limit is not a magic safe line. Direct sunlight can heat a battery cabinet far beyond the surrounding air.
Check the battery display, charger log, and temperature sensor reading together. A practical test is simple: measure the cabinet after several hours of afternoon sun. Then compare it with the reading taken before sunrise. Allow the battery to cool for at least 30 minutes before retrying. Never bypass a temperature cutoff. Inspect blocked vents, dusty filters, loose sensor plugs, and poor airflow around the enclosure.
Industry scale makes this issue increasingly important. The International Energy Agency reported that global electric-vehicle battery demand exceeded 750 GWh in 2023, rising by about 40% from the previous year. Its Batteries and Secure Energy Transitions report also identifies thermal control as important for safety and durability. EPRI’s 2023 Energy Storage Technology and Cost Characterization Report treats thermal management as a core storage-system function.
A weak sensor can create a false temperature alarm. I have seen troubleshooting stop too early after checking only the battery percentage. That was incomplete. Record temperature, charging current, and cutoff time together. Temperature may be the missing clue.
Step 5—Run a Capacity Test and Compare Results With the 80% End-of-Life Benchmark
A battery percentage on the screen is not a capacity test. Charge the battery fully, then record the starting voltage, temperature, and state of charge. Disconnect nonessential loads. Measure the energy delivered until the battery reaches its specified minimum voltage. Use a calibrated meter, and keep the discharge rate steady. Sandia National Laboratories’ energy-storage testing protocol recommends controlled conditions because temperature, current, and rest time can change the result. Repeat the test twice. One result can mislead you.
Calculate actual capacity by dividing delivered energy by the battery’s original rated energy. Multiply by 100. The U.S. Department of Energy’s Battery Test Manual identifies 80% of beginning-of-life capacity as a common end-of-life reference for many rechargeable battery applications. For example, a 10 kWh battery delivering only 7.6 kWh has reached 76%. It may still operate, but its usable reserve has declined significantly. Check the warranty terms and manufacturer specifications, because some stationary systems use different limits.
Keep the test area ventilated. Stop immediately if the battery becomes unusually hot, swollen, or unstable. I have seen users blame degradation when a loose cable caused voltage loss. That mistake is easy to make. Inspect connections, inverter settings, and temperature readings before replacing the battery. Record every test date, load level, and delivered kilowatt-hour value. The trend matters more than one imperfect measurement.
Disconnect charging and loads. Wait at least 30 minutes. Measure voltage at the battery terminals with a calibrated multimeter.Record the temperature. A cold morning can change the reading.
Surface charge can make a battery appear healthier than it is. Heavy loads can also make voltage look dangerously low.Voltage is only a clue.
Compare voltage, charging current, discharge current, reported SOC, cell voltages, temperature, and protection status.Use a DC clamp meter. Near-zero current gives a cleaner voltage estimate.
A cell spread above roughly 50–100 millivolts deserves attention, especially under load.This is a field guideline, not a universal failure limit.
Yes. A loose terminal or corroded connection can imitate a weak battery.Inspect terminals carefully. Small details matter.
Many lead-acid systems commonly use about 50% depth of discharge.A 12-volt, 200Ah battery may provide about 100Ah before recharging.
Use a shunt meter instead of relying only on the controller display.Record morning voltage, estimated load, temperature, and charging time.
It may indicate excessive depth of discharge, weak capacity, poor charging, or heavy overnight loads.A refrigerator running normally at sunset proves little.
Confirm that the charger reaches the correct absorption stage. Inspect terminals and wiring.Check electrolyte levels only on serviceable flooded batteries. Never add water to sealed batteries.
Do not replace it after one confusing voltage reading. Rest the battery, check loads, review charging, and compare cell data.I once trusted the displayed percentage too quickly. That was careless. Arrange qualified testing if capacity remains low.
If you are asking, “why is my solar battery not holding charge,” begin by checking its chemistry, age, and expected cycle life. LiFePO₄ batteries commonly provide around 3,000–6,000 cycles, while other battery types may have different limits. Use battery voltage, charging and discharging current, and available BMS data to confirm the actual state of charge rather than relying only on the display. Also review the battery’s depth of discharge, since lead-acid batteries commonly perform best when routinely discharged to no more than about 50%.
Next, verify that the charger settings match the manufacturer’s recommended voltage and current limits. Inspect the installation for temperature-related protection or charging interruptions, particularly when conditions fall outside the typical 0–45°C charging range. Finally, perform a controlled capacity test and compare the measured result with the battery’s rated capacity. If it delivers less than approximately 80%, it may be approaching its practical end of life and require professional evaluation or replacement.

Vires Energy